Models and Simulations
Relative Atmospheric Angular Momentum (AAM) and Length-of-Day (LOD) Variations during Climate Change

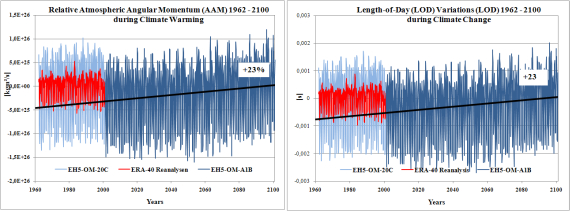
Left: Relative atmospheric angular momentum (AAM) is computed following Barnes et al. (Proc. R. Soc. London A387, 1983). Data used are zonal winds on pressure levels between 1000hPa and 10hPa from ERA-40 reanalysis data and IPCC scenarios for the 20th -20C- (1962-2000) und 21st -A1B- (2001-2100) century of the coupled atmosphere-ocean model ECHAM5-OM1. The displayed time series show monthly anomalies for the relative AAM in units of [kgm²/s].
Right: Conversion of relative AAM anomalies from units of mass [kgm²/s] into length-of-day variations in units of [s] following Rosen (Surveys in Geophysics, 1993).
Anomalies are calculated as the difference between monthly absolute values minus a 30-year base period that is the climate mean of the specific time serie used. The climate mean for ERA-40 and EH5-OM-20C refers to the mean of 1971-2000, and for the A1B data to the mean of 2071-2100. The bold black trend line describes a increase of the relative AAM and LOD, respectively, from present times (1962) to the end of the 21st century (2100). Comparing the 30-year climate mean for 20C (1971-2000) and for the A1B scenario (2071-2100) yields an increase in relative AAM and LOD, respectively, by 23%.
The corresponding data as well as information on the models and data can be found in the following Excel file:
![]() Relative Atmospheric Angular Momentum (AAM) and Length-of-Day (LOD) Variations during Climate Change: Excel tables containing information and data (vnd.ms-excel/1072 KB)
Relative Atmospheric Angular Momentum (AAM) and Length-of-Day (LOD) Variations during Climate Change: Excel tables containing information and data (vnd.ms-excel/1072 KB)
